Explainer: why sea level will rise for decades after we reach net zero carbon
The sea has been rising and falling for eons, but there is compelling evidence that carbon emissions from human activity is speeding the process along.
The sea has been rising and falling for eons, but there is compelling evidence that carbon emissions from human activity is speeding the process along.

Lachlan Gilbert
UNSW News & Content
(02) 9065 5241
lachlan.gilbert@unsw.edu.au
If you were to dig a (very) deep hole that passed through the centre of the Earth and kept going to the other side of the planet, where do you think you’d come out?
Unless you start digging from a handful of locations on the planet, you are very likely to find that the – or opposite point on Earth to where you are now – will .
While this might be surprising initially, it isn’t really when you realise that land only covers 29 per cent of the Earth’s surface, and even then, isn’t distributed evenly.
So how much water is there actually on the planet – in liquid, solid and gas form? And why are we in danger of the sea reclaiming some of the Earth’s land – aka rising sea levels?
There is estimated to be more than 1 billion cubic kilometres of water on the planet, or 1,386,000,000 km3 to be precise. This includes all of the water in the ocean (about 97 per cent) and the total amount of water in ice sheets, glaciers and snow (1.74 per cent) and in ground water (1.69 per cent, over half of which is saline and much of it is inaccessible).
The accessible fresh water we rely on for drinking and irrigating – from rivers, lakes, dams, aquifers, the atmosphere and melting glaciers – is only a tiny fraction of the world’s total fresh water – or 0.4 per cent. The remainder of the world’s fresh water – or 2.5 per cent of the world’s total water -- is locked away in glaciers, polar ice sheets or underground in aquifers.
It is partly the ratio between liquid and solid form of water at any given time – specifically water in the oceans versus that contained in and glaciers – that determines how high our seas rise above a land mass’s continental shelf.
Climate scientist and oceanographer says melting ice and freezing water is part of a long pattern of warming and cooling of the planet that goes back millions of years.

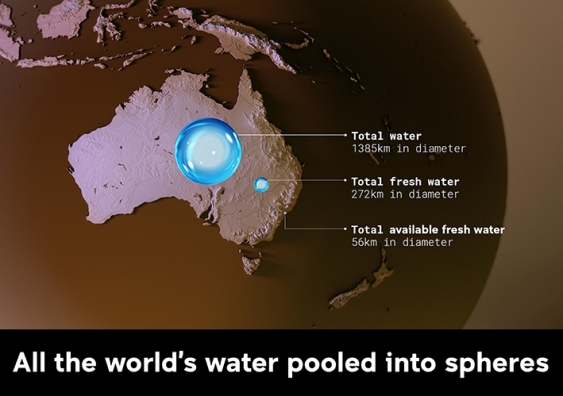
All the water in the world would make a sphere 1385km in diameter. By comparison, all fresh water would make a 272km sphere, while the fresh water available for drinking and irrigation would make a 56km sphere. Image: Ian Joson/UNSW
“Sea level has varied throughout history – from the formation of the Earth’s supercontinents like Pangea and Gondwanaland right to present times,” he says.
“In the last million years, sea level has varied on a 100,000 year cycle by rising and dropping more than 100 metres. The last interglacial period – in other words, the last warm period prior to the present warm period – was about 129,000-116,000 years ago.
“As the world cooled and moved towards what we call the Last Glacial Maximum 23,000-19,000 years ago, sea level fell to more than 120 metres below present-day sea levels. And then when the climate swung towards warming again, sea level rose rapidly at an average rate of more than 1 metre per century for many millennia and peak rates in excess of four metres per century.”
That was until about 8000 years ago, when the rate of sea level rise slowed to the point that it took millennia, rather than centuries, to rise a few metres. Then in the last 2000 years, sea level rise slowed virtually to a standstill – changing by just fractions of millimetres per year over this period, Prof. Church says.
“That started to change in the 1800s when sea level measurements showed that sea level started to rise more quickly, accelerating through the 19th century and is continuing to accelerate today.”
In fact, rates of sea level rise have escalated from . This is the .
While a changing climate has always been part of a natural cycle throughout the Earth’s history, the accelerated warming and subsequent rise in sea level has been boosted by a human-induced rise in atmospheric carbon dioxide (and other greenhouse gases). Carbon emissions dating back to the industrial revolution in the early 19th century have contributed to the greenhouse effect by trapping heat from the sun that would otherwise have been reflected back into space.
“It has been shown that warming from greenhouse gas emissions has had a dominant effect in sea level rise in the latter half of the 20th century, and most probably the first half as well,” Prof. Church says.
What many may not realise, however, is that melting ice sheets at the planet’s poles are not the only driver of accelerated sea level rise to date. Prof. Church says the real danger of melting ice sheets will become increasingly important through the 21st century, particularly in the latter half. Three other drivers will also play an important role.
“Thermal expansion of the ocean is one of the largest single components leading to sea level rise over recent decades, which is responsible for a third of sea level rise to date,” Prof. Church says.
This relates to the basic physical properties of H2O – as water warms, the atoms and electrons in the water molecules become excited and move about so that they take up more space. In small amounts, the extra volume is difficult to observe as water heats by just a few degrees. But when you scale this up to an unimaginable number of water molecules in the ocean, the tiny expansions add up to something we can see.
Another significant contributor is the loss of mass from glaciers which are large masses of ice in addition to the huge ice sheets of Greenland and Antarctica.
“Melting or loss of mass from glaciers could account for 40cm of sea level rise over the longer term,” Prof. Church says. “The glaciers I’m referring to here are in places like the Himalayas, Alaska, Patagonia in particular, and the glaciers on the periphery of the Greenland ice sheet.”
A final influence on sea level, although acknowledged as a smaller contribution, is the exchange of water between the land and the ocean.
“We’re taking water out of aquifers for irrigation which either evaporates into the atmosphere to fall back on land or into the ocean as rain, or it may run off into oceans or rivers or dams. This is partly counterbalanced by the storage of water in reservoirs. But these effects are not nearly as dominant as thermal expansion and glacial melting over decades, or melting of the ice sheets in the longer term.”

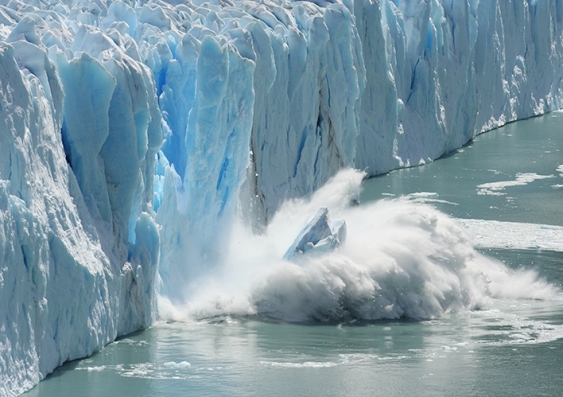
There is at least 60 metres worth of sea level rise contained in the ice sheets and glaciers around the world. Photo: Shutterstock
One way to measure how melting ice sheets and glaciers could affect sea level is to measure their sea level potential.
“The ice sheets in Antarctica and Greenland hold a combined volume of more than 60 metres of sea level equivalent,” Prof. Church says.
“Water in glaciers meanwhile hold about 40 centimetres of sea level equivalent, and there’s a couple of centimetres total in the atmosphere.”
But if global warming continues unabated, even if a small fraction of the ice from glaciers and ice sheets melted it could have potentially devastating effects on the human and animal population of the planet.
“If we don’t take any mitigation actions to curb our carbon emissions, then by 2100 you’re talking about a rise of up to a metre, or maybe more if there is a rapid contribution from Antarctica, and an ongoing rapid rise in sea level. But if we do take significant mitigation steps, then we might limit the rise to 50 or 60cm by the end of the century and a much slower rate of ongoing rise.
“We cannot stop all sea level rise. Even with mitigation, the warming of the oceans and loss of mass from glaciers and ice sheets will contribute to sea level rise for decades and even centuries.”
In other words, even if we kept to the Paris Agreement of keeping temperatures from rising above 1.5oC – a feat that most climate scientists agree is challenging but not yet impossible to achieve – sea level is still expected to rise by up to about 50cm by 2100.
What would this look like?
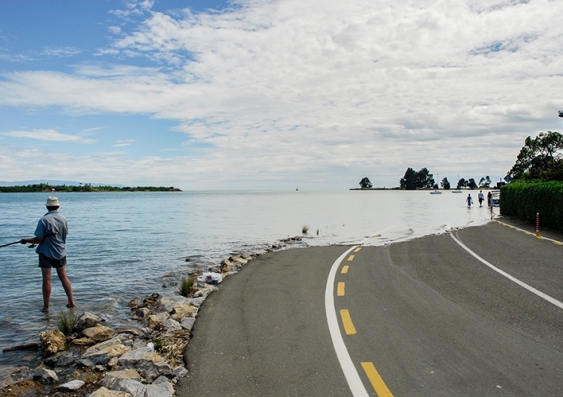
“There would be a lot more coastal flooding, and not just at the coast but along the estuaries as well. And we’ve already seen that in Australia on the east coast and west coast during the 20th century, the frequency of high sea level events has increased by a factor of three.
“So what used to be a once in 30 year event is now a once in 10 year event. And that impact is felt right around the world. And that impact will become worse during the 21st century.”
The rule of thumb is, for every 10cm rise in sea level, you increase the frequency of these one in 100 year coastal flooding events by a factor of three, Prof. Church says. Of course, the high sea level water mark, which you could observe at places like Sydney Harbour, will be higher.
“Mean sea level will be higher which means high tides will be higher, as well as low tides. And even without a storm surge in the future, you could have coastal flooding because the sea level to start with is higher.

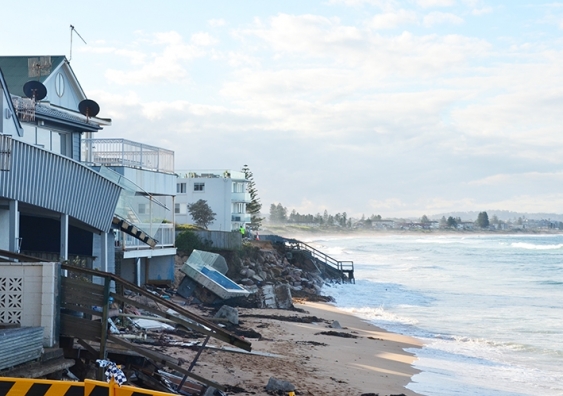
The coastal storm that lashed Collaroy Beach in 2016 may be a taste of what is to come as sea level rises by up to a metre by the end of the century. Photo: Shutterstock
“So events like the will lead to greater coastal erosion.”
But if temperatures are not kept well below two degrees, there is a real danger that the melting of ice sheets will pass a point of no return.
“If we have warming of more than 2 degrees Celsius in coming decades, we could expect almost a metre of sea level rise by 2100. And in the coming centuries, several metres from the melting of the ice sheets in Greenland alone.
“The problem is temperatures will cross thresholds where we can no longer stop this process leading to many metres of sea level rise. It’s very hard to reduce temperatures, and once we get to a certain level, we might be able to stabilise them, but to bring them down takes time.”
Does Prof. Church think we’ve passed that threshold?
“Probably not as yet for Greenland, but I don’t think we can say unequivocally we have not passed that threshold or that there will not be significant contributions to sea level rise from Greenland.
“Similarly, for Antarctica, we are at least approaching thresholds which will lead to ongoing decay of the ice sheet and additional metres of sea level rise. But we don’t understand Antarctica well enough to say exactly what the thresholds are and at what rate sea level will rise over coming centuries.”
Prof. Church says there are three ways to deal with sea level rise in addition to major policy-driven initiatives to curb emissions.
“We can protect the coastline by building physical barriers,” he says. “Parts of the Netherlands is below sea level and it’s protected by dykes. London has the Thames barrier which protects £100 million of infrastructure from storm surges, and Rotterdam has a similar barrier. But this is too expensive to do everywhere.”
A second method of dealing with the rising seas is to adapt to it by building infrastructure on poles or by designating outdoor facilities like sports grounds for low lying areas such that flooding will not do huge amounts of damage to them.
“Or we can simply retreat from the coastline.
And we’ll do all three of these things in various parts of the world. In fact, we’re already doing all three of them,” Prof. Church says.
“If we fail to mitigate our emissions adequately, retreat will be the main adaptation method for many parts of the world, resulting in abandoning large tracts of valuable coastal land and displacing hundreds of millions of people.”